Financial Accounting: The Impact on Decision Makers
10th Edition
ISBN: 9781305654174
Author: Gary A. Porter, Curtis L. Norton
Publisher: Cengage Learning
expand_more
expand_more
format_list_bulleted
Videos
Textbook Question
Chapter 2, Problem 2.9P
Basic Elements of Financial Reports
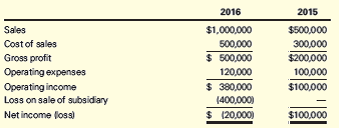
Comparative income statements for Grammar Inc. are as follows:
Required
The president and management believe that the company performed better in 2016 than it did in 2015. Write the president’s letter to be included in the 2016 annual report. Explain why the company is financially sound and why shareholders should not be alarmed by the $20,000 loss in a year when operating revenues increased significantly.
Expert Solution & Answer
Want to see the full answer?
Check out a sample textbook solution
Students have asked these similar questions
The financial statements for Tyler Toys, Inc. are shown in the popup window:
LOADING...
.
Calculate the profit margin, return on assets, and return on equity for 2013 and 2014 for Tyler Toys. Should any of these ratios or the change in a ratio warrant concern for the managers of Tyler Toys or the shareholders?
Tyler Toys, Inc.
Income Statement for Years Ending December 31, 2013 and 2014
2014
2013
Revenue
$14,146,094
$13,567,551
Cost of goods sold
$-8,448,688
$-8,131,338
Selling, general, and administrative expenses
$-998,878
$-980,620
Depreciation
$-1,497,580
$-1,472,740
EBIT
$3,200,948
$2,982,853
Interest expense
$-376,634
$-354,060
Taxes
$-1,073,239
$-998,941
Net income
$1,751,075
$1,629,852
Right-click on the table and select Copy to Clipboard and then right-click the
highlighted texts in the popup dialogue box and select Copy in order to paste its…
The financial statements for Tyler Toys, Inc. are shown in the popup window:
LOADING...
.
Calculate the profit margin, return on assets, and return on equity for 2013 and 2014 for Tyler Toys. Should any of these ratios or the change in a ratio warrant concern for the managers of Tyler Toys or the shareholders?
Tyler Toys, Inc.
Income Statement for Years Ending December 31, 2013 and 2014
2014
2013
Revenue
$14,147,690
$13,566,481
Cost of goods sold
$-8,447,054
$-8,131,319
Selling, general, and administrative expenses
$-998,405
$-981,658
Depreciation
$-1,498,619
$-1,472,478
EBIT
$3,203,612
$2,981,026
Interest expense
$-376,184
$-355,975
Taxes
$-1,074,423
$-997,519
Net income
$1,753,005
$1,627,532
Right-click on the table and select Copy to Clipboard and then right-click the
highlighted texts in the popup dialogue box and select Copy in order to paste its…
Please find below Financial Statement extracts of Nestle from year 2017 and 2018. Based on this information please
answer following question from a perspective of Financial Analyst (justify your answers with data as well the
reason for choosing your ratios for your analysis) .The company's total assets at year-end 2016 were 131,900
million. What reasonable conclusions an analyst might make about the companies efficiency, Companies solvency,
Liquidity and Profitability?
2018
2017 *
Sales
91,439
89,590
Profit for the year
10,468
7,511
Assets
2018
2017 *
Total current assets
41,003
31,884
Total assets
137,015
133,210
Total liabilities and equity
137,015
133,210
Chapter 2 Solutions
Financial Accounting: The Impact on Decision Makers
Ch. 2 - Read each definition below and write the number of...Ch. 2 - Prob. 2.1ECh. 2 - The Operating Cycle Two Wheeler Cycle Shop buys...Ch. 2 - Classification of Financial Statement Items Regal...Ch. 2 - Current Ratio Baldwin Corp. reported the following...Ch. 2 - Classification of Assets and Liabilities Indicate...Ch. 2 - Selling Expenses and General and Administrative...Ch. 2 - Prob. 2.7ECh. 2 - Income Statement Ratio The income statement of...Ch. 2 - Statement of Retained Earnings Landon Corporation...
Ch. 2 - Components of the Statement of Cash Flows Identify...Ch. 2 - Prob. 2.11ECh. 2 - Prob. 2.12MCECh. 2 - Prob. 2.13MCECh. 2 - Prob. 2.14MCECh. 2 - Materiality Joseph Knapp, a newly hired accountant...Ch. 2 - Costs and Expenses The following costs are...Ch. 2 - Prob. 2.3PCh. 2 - Prob. 2.4PCh. 2 - Working Capital and Current Ratio The balance...Ch. 2 - Single-Step Income Statement The following income...Ch. 2 - Multiple-Step Income Statement and Profit Margin...Ch. 2 - Statement of Cash Flows Colorado Corporation was...Ch. 2 - Basic Elements of Financial Reports Comparative...Ch. 2 - Prob. 2.10MCPCh. 2 - Prob. 2.11MCPCh. 2 - Prob. 2.12MCPCh. 2 - Prob. 2.1APCh. 2 - Prob. 2.2APCh. 2 - Prob. 2.3APCh. 2 - Prob. 2.4APCh. 2 - Working Capital and Current Ratio The balance...Ch. 2 - Single-Step Income Statement The following income...Ch. 2 - Prob. 2.7APCh. 2 - Prob. 2.8APCh. 2 - Prob. 2.9APCh. 2 - Comparability and Consistency in Income Statements...Ch. 2 - Prob. 2.12AMCPCh. 2 - Prob. 2.1DCCh. 2 - Prob. 2.2DCCh. 2 - Analysis of Cash Flow for a Small Business...Ch. 2 - Prob. 2.4DCCh. 2 - The Expenditure Approval Process Roberto is the...Ch. 2 - Prob. 2.6DC
Knowledge Booster


Learn more about
Need a deep-dive on the concept behind this application? Look no further. Learn more about this topic, accounting and related others by exploring similar questions and additional content below.Similar questions
- Computing and Interpreting Financial Statement Ratios Following are selected ratios of Colgate-Palmolive for 2015 and 2014. Return on Assets(ROA) Component 2015 2014 Profitability (Net income/Sales) 7.80% 11.30% Productivity (Sales/Average assets) 1.37 1.28 a. Was the company profitable in 2015? What evidence do you have of this? ONo, Colgate-Palmolive was not profitable as evidenced by its decrease in its net profit margin. OYes, Colgate-Palmolive was profitable as evidenced by its positive net profit margin. b. Is the change in productivity (asset turnover) a positive development? ONo, the increase indicates more operating assets were needed to generate the same level of sales as the prior year. OYes, the increase indicates that operating assets generated a higher level of sales than the prior year. c. Compute the company's ROA for 2015. Round answer to one decimal place (ex: 0.2345 = 23.5%).arrow_forwardComputing and Interpreting Financial Statement Ratios Following are selected ratios of Norfolk Southern for 2018 and 2017. Return on Assets (ROA) Component 2018 2017 Profitability (Net income/Sales) 24.3% 52.2% Productivity (Sales/Average assets) 0.328 0.309 a. Was the company profitable in 2018?AnswerYesNo b. Was the company more profitable in 2018 or 2017?Answer20172018 c. Is the change in productivity a positive or negative development?AnswerPositiveNegative d. Compute the company’s ROA for 2018 and for 2017.Note: Round answers to one decimal places (example: 10.4%). ROA 2018 Answer 2017 Answerarrow_forwardQuestion # 5: You are a financial manager in Gama Corporation. You have the task of getting the company back into a sound financial position. Gama Corporation’s 2017 and 2018 balance sheets and income statements, together with projections for 2019, are shown in the following tables. The tables also show the 2017 and 2018 financial ratios, along with the industry average data. Your assignment is to answer the following questions. Provide clear explanations, not yes or no answers. Show your work for the calculations. Balance Sheets Assets 2017 2018 2019 (Projected) Cash $ 9,000 $ 7,282 $ 14,000 Short-Term Investments. 48,600 20,000 71,632 Accounts Receivable 351,200 632,160 878,000 Inventories 715,200 1,287,360 1,716,480 Total Current Assets $ 1,124,000 $ 1,946,802 $ 2,680,112 Gross Fixed Assets 491,000…arrow_forward
- Use the following tables to answer the question: LOGIC COMPANY Income Statement For years ended December 31, 2016 and 2017 (values in $) 2016 2017 Gross sales 19,800 15,600 Sales returns and allowances 900 100 Net sales 18,900 15,500 COGS 11,800 8,800 Gross profit 7,100 6,700 Depreciation 780 640 Selling and administrative expenses 2,800 2,400 Research 630 540 Miscellaneous 440 340 Total operating expenses 4,650 3,920 Income before interest and taxes 2,450 2,780 Interest expense 640 540 Income before taxes 1,810 2,240 Provision for taxes 724 896 LOGIC COMPANY Balance Sheet For years ended December 31, 2016 and 2017 (values in $) 2016 2017 Current assets 12,300 9,400 Accounts receivable 16,900 12,900 Merchandise inventory 8,900 14,400 Prepaid expenses 24,400 10,400 Total current assets 62,500 47,100 Building (net) 14,900 11,400 Land 13,900 9,400 Total plant and equipment 28,800 20,800 Total assets 91,300 67,900 Accounts payable 13,400 7,400 Salaries payable 7,500 5,400 Total current…arrow_forwardComputing and Interpreting Financial Statement Ratios Following are selected ratios of Norfolk Southern for 2018 and 2017. Return on Assets (ROA) Component 2018 2017 Profitability (Net income/Sales) 25.3% 53.2% Productivity (Sales/Average assets) 0.338 0.319 a. Was the company profitable in 2018?Answer b. Was the company more profitable in 2018 or 2017?Answer c. Is the change in productivity a positive or negative development?Answer d. Compute the company’s ROA for 2018 and for 2017. Note: Round answers to one decimal places (example: 10.4%). ROA 2018 Answer 2017 Answer e. From the information provided, which of the following best explains the change in ROA during 2018? Answerarrow_forwardFINANCIAL RATIOS Required: a. Compute for the company's profitability and operating efficiency ratios in 2014. b. Compute for the financial health ratios of the company in 2014 and 2013. Very Berry Company Very Berry Company Statement of Comprehensive Income Statement of financial Position For the year ended December 31 For the year ended December 31 2014 2013 400,000 5,600,000 2014 2013 Cash 180,000 Short-term Investments 1,800,000 Sales 10,040,000 8,760,000 Accounts Receivable 1,480,000 1,060,000 Cost of Goods Sold 5,680,000 5,860,000 Inventory 1,380,000 1,640,000 4,360,000 1,160,000 Gross Profit 2,800,000 8,860,000 10,860,000 Other Current Assets 4,680,000 Operating Expenses Operating Income Interest Expense 1,680,000 Total Current Assets 5,040,000 1,20,000 28,000 3,200,000 Equipment 6,800,000 5,200,000 100,000 Total Assets 17,660,000 10,240,000 3,100,000 Accounts Payable Notes Payable - long term Owner, Capital Total Liabilities and Capital 2,620,000 2,120,000 Net Income 1,192,000…arrow_forward
- Oriole Corporation recently filed the following financial statements with the SEC. Look at the image for the balance sheet and more! Oriole CorporationIncome Statement for the FiscalYear Ended July 31, 2017 Net sales $77,630 Cost of products sold 55,218 Gross profit $22,412 Selling, general, and administrative expenses 9,893 Depreciation 1,124 Operating income (loss) $11,395 Interest expense 688 Earnings (loss) before income taxes $10,707 Income taxes 3,748 Net earnings (loss) $6,959 Use the DuPont identity to calculate the return on equity (ROE). In the process, calculate the following ratios: net profit margin, total asset turnover, equity multiplier, EBIT return on assets (EROA), and return on assets. (Do not round intermediate calculations. Round answers to 2 decimal places, e.g. 52.75 or 52.75%.) Net profit margin % Total asset turnover Equity multiplier EBIT return on assets % Return on assets %…arrow_forwardHorizontal Analysis of Income Statement For 2012, McDade Company reported a decline in net income. At the end of the year, T. Burrows, the president, is presented with the following condensed comparative income statement: McDade Company Comparative Income Statement For the Years Ended December 31, 2012 and 20Y1 20Y2 20Y1 Sales Cost of goods sold Gross profit Selling expenses Administrative expenses Total operating expenses Income from operations Other revenue Income before income tax Income tax expense Net income Required: $917,320 $760,000 681,600 480,000 $235,720 $280,000 $97,600 $64,000 55,120 40,000 $152,720 $104,000 $83,000 $176,000 3,200 4,054 $87,054 $179,200 24,400 53,800 $62,654 $125,400 1. Prepare a comparative income statement with horizontal analysis for the two-year period, using 20Y1 as the base year. Round percentages to one decimal place. Use the minus sign to indicate a decrease in the "Increase (Decrease)" columns. McDade Company Comparative Income Statement For the…arrow_forwardThe following balances were reported in the financial statements for Ruby Company. 2016 2015 Net Sales $1,650,000 $1,750,000 Net Income 170,000 205,000 Current Assets 410,000 535,000 Current Liabilities 170,000 210,000 Total Liabilities 500,000 675,000 Total Assets 1,550,000 2,450,000 Required: 1. Compute the following ratios for 2016 and 2015 for Ruby Company. a. Return on sales ratio b. Current ratio c. Debt-to-total-assets ratioarrow_forward
- The financial statements for Tyler Toys, Inc. are shown in the popup window: LOADING... . Calculate the current ratio, quick ratio, and cash ratio for Tyler Toys for 2013 and 2014. Should any of these ratios or the change in a ratio warrant concern for the managers of Tyler Toys or the shareholders? Tyler Toys, Inc. Income Statement for Years Ending December 31, 2013 and 2014 2014 2013 Revenue $14,146,091 $13,567,817 Cost of goods sold $-8,447,104 $-8,131,461 Selling, general, andadministrative expenses $-998,668 $-981,881 Depreciation $-1,498,161 $-1,471,091 EBIT $3,202,158 $2,983,384 Interest expense $-375,459 $-354,144 Taxes $-1,074,146 $-999,111 Net income $1,752,553 $1,630,129 Right-click on the table and select Copy to Clipboard and then right-click the highlighted texts in the popup dialogue box and select Copy in order to paste its contents…arrow_forwardPlease find below Financial Statement extracts of Nestle from year 2017 and 2018. Based on this information please answer following question from a perspective of Financial Analyst (justify your answers with data as well the reason for choosing your ratios for your analysis) .The company’s total assets at year-end 2016 were CHF 131,900 million. What reasonable conclusions an analyst might make about the companies efficiency, Companies solvency, Liquidity and Profitability? In millions of CHF Notes 2018 2017 * Sales 3 91,439 89,590 Cost of goods sold (46,070) (45,571) Trading operating profit 3 13,789 13,277 Operating profit 13,752 10,156 Profit before taxes, associates and joint ventures 12,991 9,460 Taxes 13 (3,439) (2,773) Profit for the year 10,468 7,511 Notes 2018 2017 * Assets Current assets Cash and cash equivalents 12/16…arrow_forwardAnalyzing Financial Data: Trend Analysis. Presented below is selected financial data for Apple Inc., for the five-year period 2015 to 2019. (in millions) Net sales Net income Dividends (per share) Total assets Noncurrent liabilities Total shareholders' equity Cash, cash equivalents, and marketable securities Required 1. Comment on the relationship between the growth in net sales and the growth in net income over the period 2015 to 2019 and what that implies regarding cost expenses. Note: Round the percentages to two decimal points (i.e. show 14.445% as 14.45%). From 2015 to 2019 sales grew by: 0 % From 2015 to 2019 net income grew by: 0 % Was Apple able to achieve greater efficiencies with their growth? Financial leverage 2. Comment on the company's financial leverage over this period. Note: Round the amounts to two decimal points (i.e. show 14.445 as 14.45). 2019 2018 2015 https: 2019 2018 2017 2016 2015 $234,157 $239,036 $206,311 $194,075 $210,344 49,730 53,578 48,351 41,118 48,055…arrow_forward
arrow_back_ios
SEE MORE QUESTIONS
arrow_forward_ios
Recommended textbooks for you
 Financial Accounting: The Impact on Decision Make...AccountingISBN:9781305654174Author:Gary A. Porter, Curtis L. NortonPublisher:Cengage Learning
Financial Accounting: The Impact on Decision Make...
Accounting
ISBN:9781305654174
Author:Gary A. Porter, Curtis L. Norton
Publisher:Cengage Learning
Consolidated financial statements; Author: The Finance Storyteller;https://www.youtube.com/watch?v=DTFD912ZJQg;License: Standard Youtube License