
Concept explainers
Videos
Hip Fracture Rates. In the paper “Very Low Rates of Hip Fracture in Beijing, People’s Republic of China,” L. Xu, A. Lu, X. Zhao, X. Chen, and S. Cummings present the results of a study on the rates of hip fracture for women and men in Beijing for the years 1990–1992 (American Journal of Epidemiology, 144, pp. 901–907). For this analysis, we consider only the hip fracture rates for women.
The following table gives the annual rate of hip fractures (per 100,000 population) for women in 14 age groups.
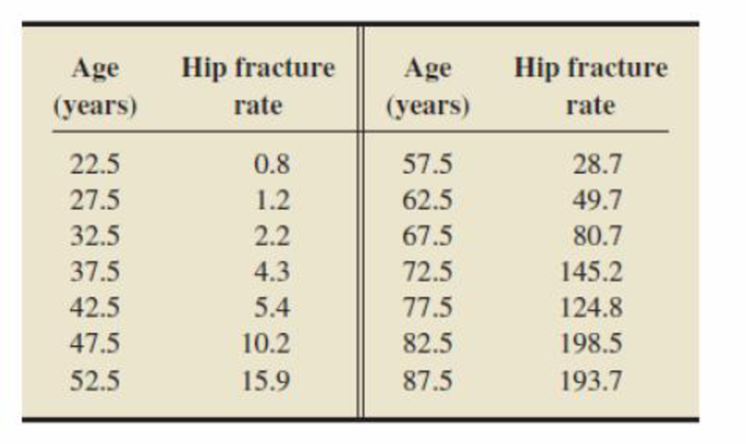
To relate hip fracture rate to age, we use the midpoint age for each age group, as depicted in the table. The
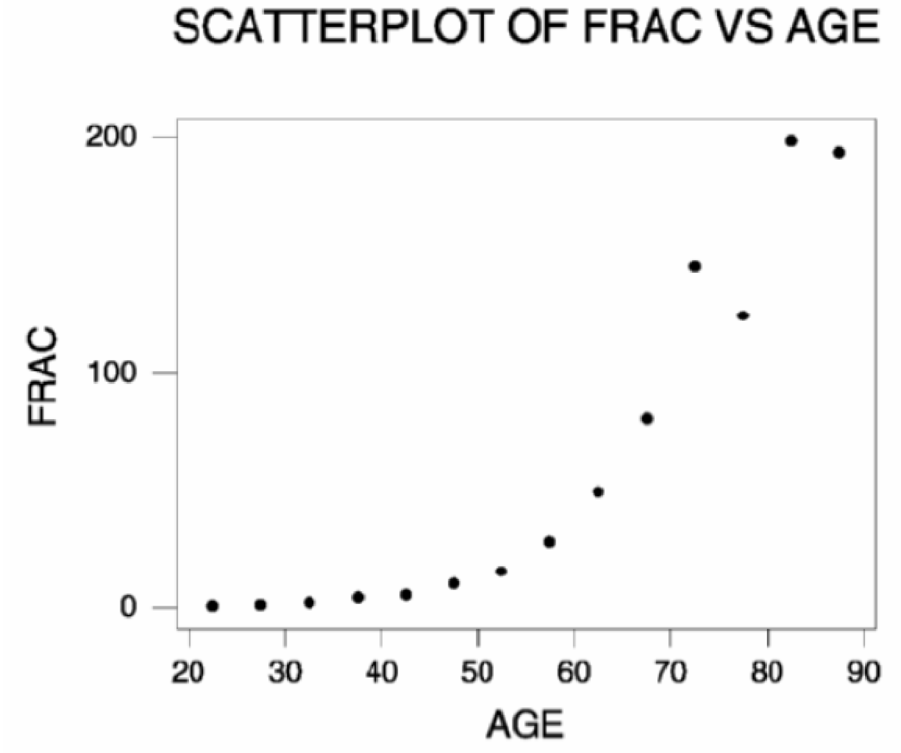
- a. In view of Output B.20, which transformations should be attempted on frac? on age?
- b. A draftsman plot of powers of frac versus powers of age is shown in Output B.21 on page B-29. Based on these plots, which pairs of transformed variables would you consider for further analysis? Explain your reasoning.
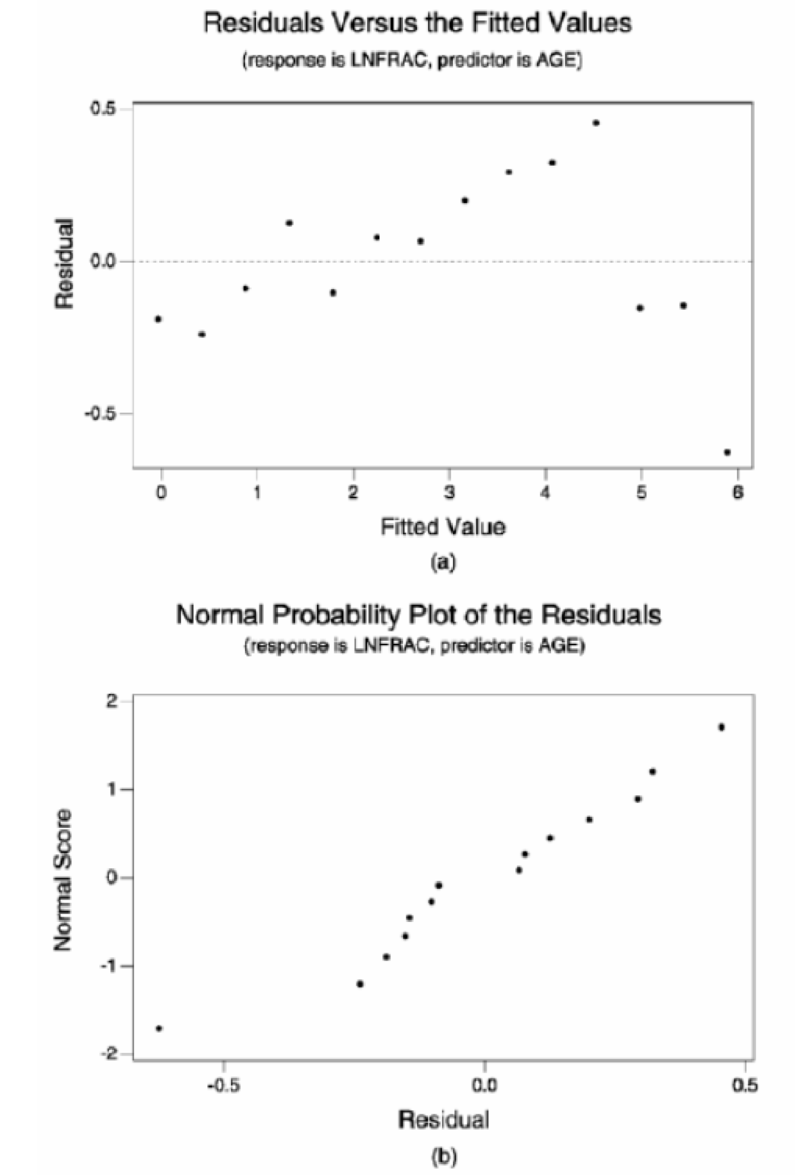
- c. The scatterplot of ln (frac) versus age appears to be fairly straight. We performed a regression of ln(frac) on age as shown in Output B.22 on page B-30. Outputs B.23(a) and (b) on page B-31 provide, respectively, a plot of residuals versus lilted values and a normal probability plot of the residuals. Perform a residual analysis to assess the assumptions of linearity of the regression constancy of the equation, conditional standard deviation, and normality of the conditional distributions. Check for outliers and influential observations.
- d. Does your analysis in part (c) reveal any violations of the assumptions for regression inferences? Explain y our answer.
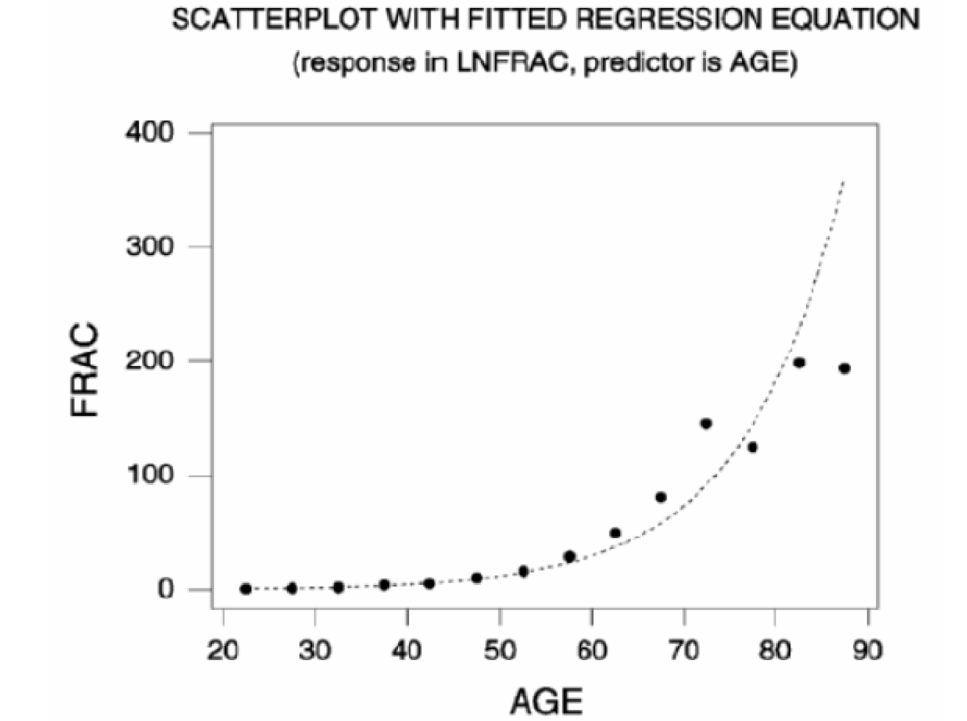
- e. Refer to the plot of the regression equation of ln(frac) on age displayed on the scatterplot in Output B.24 on page B-31. Based on this plot and the results of the residual analysis in parts (c) and (d), is the transformation in part (c) effective at straightening the scatterplot? Explain y our answer.
OUTPUT B.20
Scatterplot of frac versus age for Exercise B.25
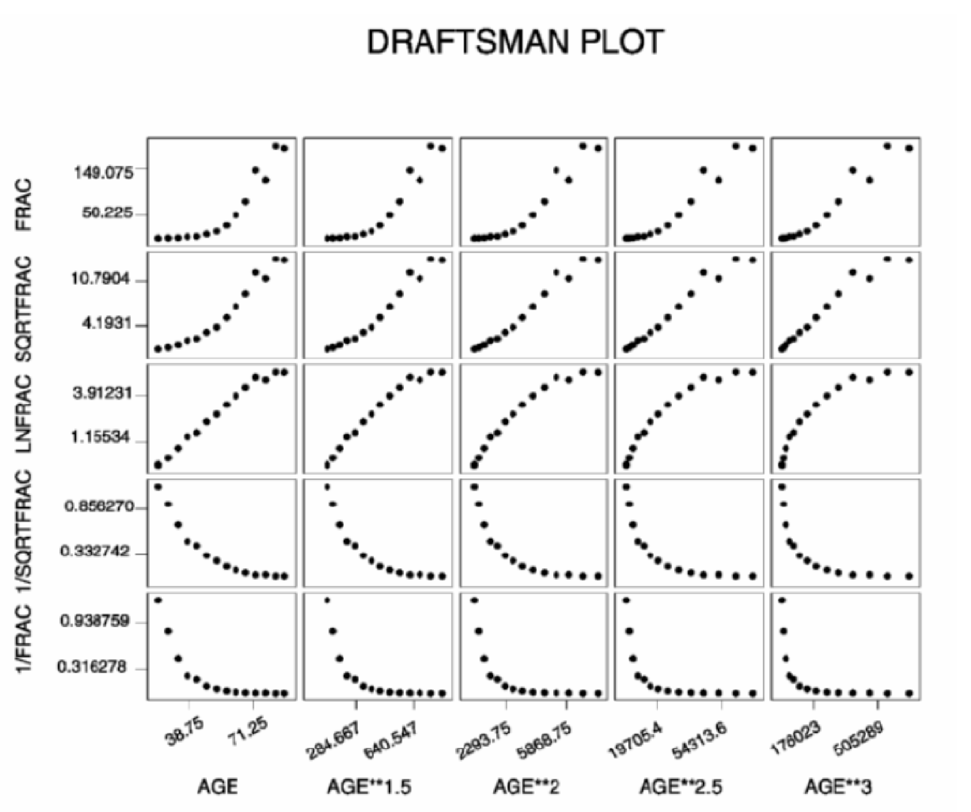
OUTPUT B.21
Draft plot for Exercise B.25
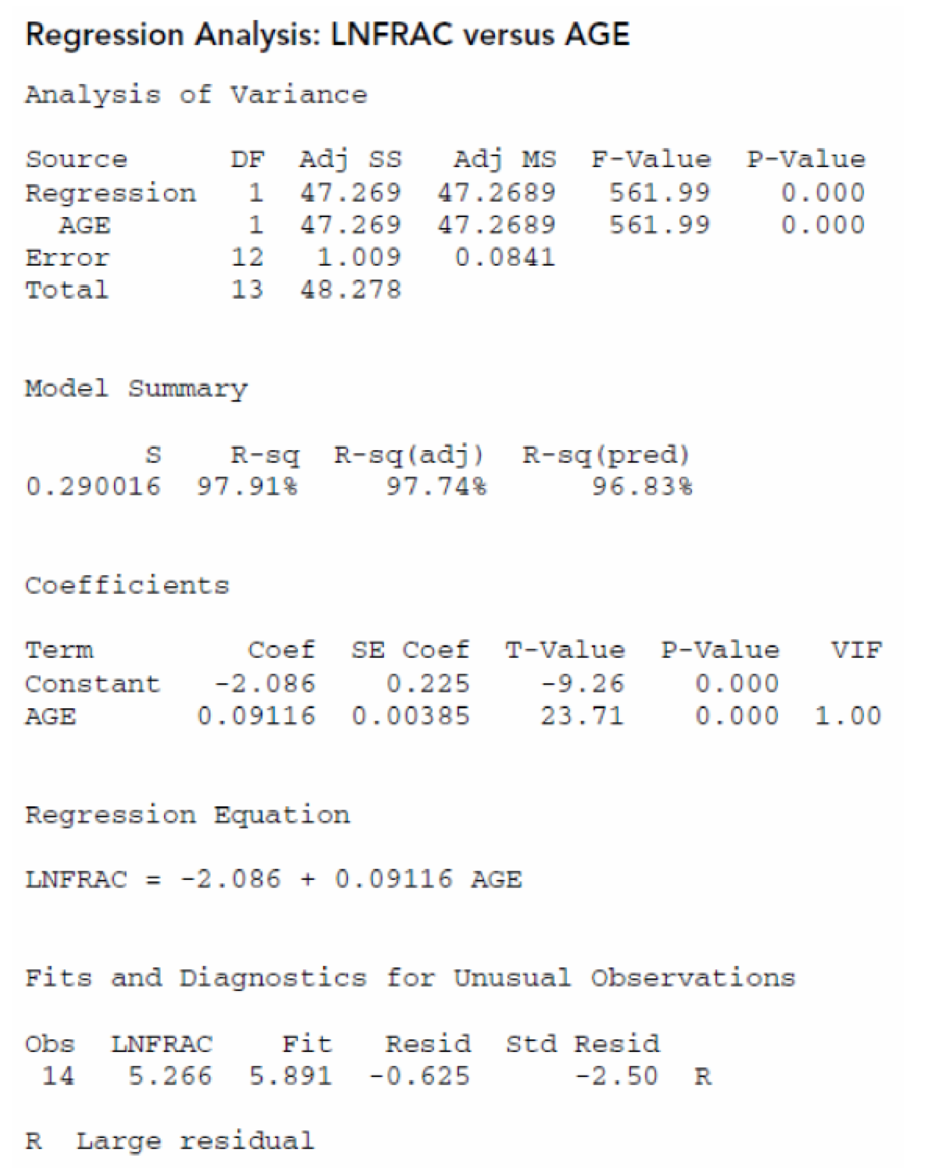
OUTPUT B.22
Output off regression of ln(frac) on age for Exercise B.25
OUTPUT B.23
Residual plots for Exercise B.25
OUTPUT B.24
Scatterplot and plot of regression equation for Exercise B.25
Want to see the full answer?
Check out a sample textbook solution
Chapter B Solutions
Introductory Statistics (10th Edition)


- (Case Study) A group of children who lived near a lead smelter in El Paso, Texas, were identified and their blood levels of lead were measured. An exposed group of 80 children were identified who had blood-lead levels 2 40 µg/mL in 1972-1973, and it was identified as group 2. A control group of 112 children were also identified who had blood-lead levels < 40 ug / mL in 1972-1973, and was identified as group-1. For both groups, the number of finger-wrist taps in the dominant hands (MAXFWT) for the both groups are displayed with a box plot as shown below: 80 70 55 49 49 40 Group-1 Group-2 How many the dominant hands between 49 and 70? children in the control group have the number of finger-wrist taps in MAKEWTarrow_forwardQ. 11 Explain the Merits and Demerits of CDR (Crude Death Rate).arrow_forwardResearchers at a local public health office are interested in the difference in prevalence of sickle cell anemia by ethnicity in a population under its jurisdiction. Suppose the following table represents prevalence of sickle cell anemia reported based on a thorough survey. Ethnicity Prevalence of Sickle Cell African-American =242/1049 Other =165/1864 Calculate the risk difference between the groups.arrow_forward
 Big Ideas Math A Bridge To Success Algebra 1: Stu...AlgebraISBN:9781680331141Author:HOUGHTON MIFFLIN HARCOURTPublisher:Houghton Mifflin Harcourt
 Glencoe Algebra 1, Student Edition, 9780079039897...AlgebraISBN:9780079039897Author:CarterPublisher:McGraw Hill