
Introductory Statistics (10th Edition)
10th Edition
ISBN: 9780321989178
Author: Neil A. Weiss
Publisher: PEARSON
expand_more
expand_more
format_list_bulleted
Concept explainers
Videos
Textbook Question
Chapter B.6, Problem 115E
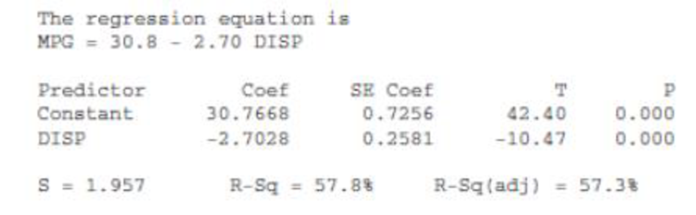
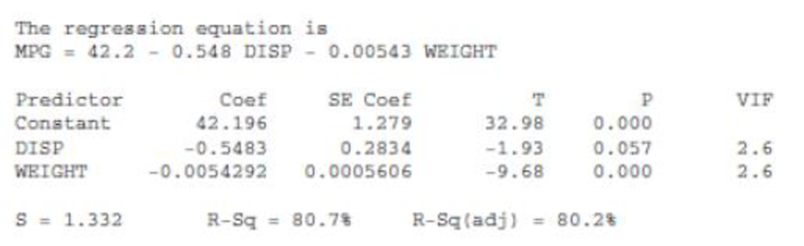
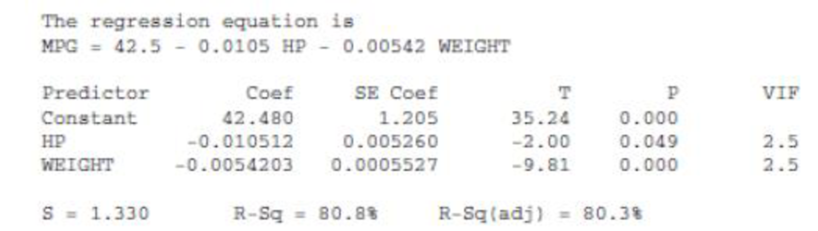
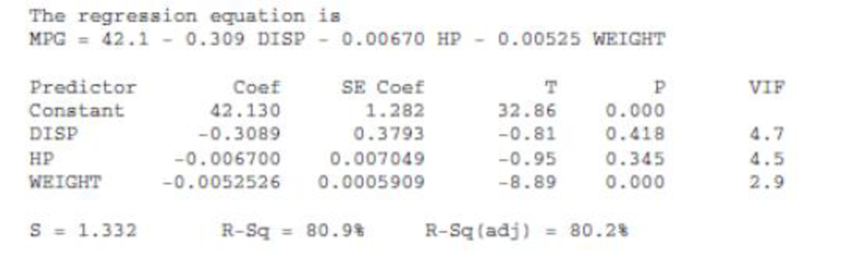
Gasoline Mileage Ratings. Refer to Exercise B.84 on page B-113, where we considered the regression of gasoline mileage (mpg) on displacement (disp), horsepower (hp), and weight (weight) for 82 vehicles classified as cars. Use Output B.69 on pages B-114–B-116 to do the following.
- a. Use the maximum-R2 criterion to obtain a regression equation for these data.
- b. Use the adjusted-R2 criterion to obtain a regression equation for these data.
- c. Use the Mallows’ Cp criterion to obtain a regression equation for these data.
- d. Do the three methods used in parts (a), (b), and (c) yield the same final regression equation? If so, is that always the case?
OUTPUT B.69 Output for Exercises B.84, B.98, and B.115
Predictor variable is disp
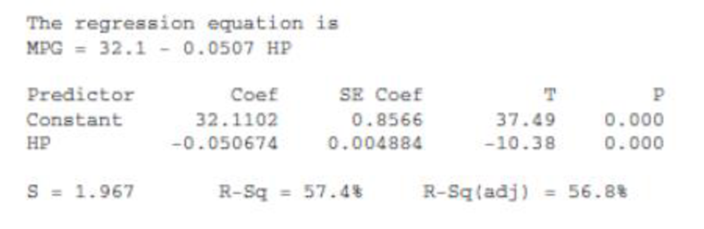
Predictor variable is hp
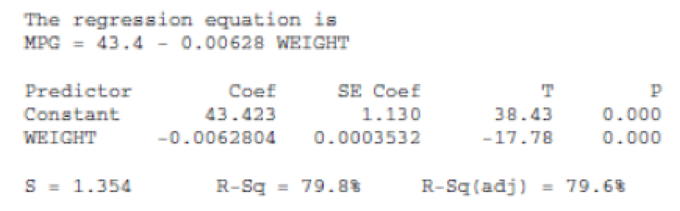
OUTPUT B.69 (cont.) Output for Exercises B.84, B.98, and B. 115
Predictor variable is weight
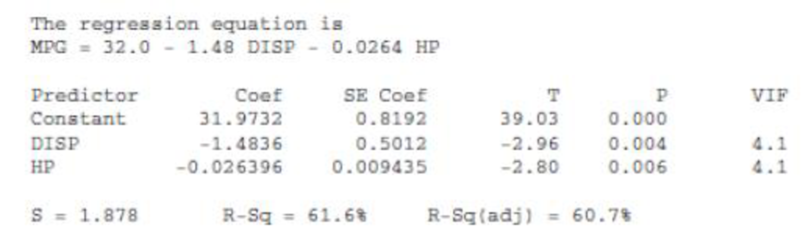
Predictor variables are disp and hp
Predictor variables are disp and weight
Predictor variables are hp and weight
OUTPUT B.69 (cont.) Output for Exercises B.84, B.98, and B. 115
Predictor variables are disp, hp, and weight
Expert Solution & Answer
Want to see the full answer?
Check out a sample textbook solution
Students have asked these similar questions
-Using the data in Table 6–11, answer the following:
What is the slope?
What is the intercept?
Write the regression equation.
Calculate a regression forecast for month 25.
Question 3.
Calculate and interpret the regression line for the data.
STER.
1. Wine Consumption. The table below gives the U.S. adult wine consumption, in gallons per
person per year, for selected years from 1980 to 2005.
a) Create a scatterplot for the data. Graph the scatterplot
Year
Wine
below.
Consumption
2.6
b) Determine what type of model is appropriate for the
1980
data.
1985
2.3
c) Use the appropriate regression on your calculator to find a
Graph the regression equation in the same coordinate
plane below.
d) According to your model, in what year was wine
consumption at a minimum? A
e) Use your model to predict the wine consumption in
2008.
1990
2.0
1995
2.1
2000
2.5
2005
2.8
Chapter B Solutions
Introductory Statistics (10th Edition)
Ch. B.1 - Regarding the regression of a response variable,...Ch. B.1 - Fill in the blanks. a. The assumption that all...Ch. B.1 - Answer true or false to each of the following...Ch. B.1 - Prob. 4ECh. B.1 - In each of Exercises B.5B.14, a. decide whether...Ch. B.1 - Prob. 6ECh. B.1 - Prob. 7ECh. B.1 - In each of Exercises B.5B.14, a. decide whether...Ch. B.1 - In each of Exercises B.5B.14, a. decide whether...Ch. B.1 - In each of Exercises B.5B.14, a. decide whether...
Ch. B.1 - In each of Exercises B.5B.14, a. decide whether...Ch. B.1 - Prob. 12ECh. B.1 - In each of Exercises B.5B.14, a. decide whether...Ch. B.1 - In each of Exercises B.5B.14, a. decide whether...Ch. B.1 - Consider the scatterplot of y versus x in Output...Ch. B.1 - Consider the scatterplot of y versus x in Output...Ch. B.1 - Prob. 17ECh. B.1 - Prob. 18ECh. B.1 - If one or both of the assumptions of...Ch. B.1 - Prob. 20ECh. B.1 - Prob. 21ECh. B.1 - Prob. 22ECh. B.1 - Prob. 23ECh. B.1 - Gasoline Mileage Ratings. Gasoline mileage and...Ch. B.1 - Hip Fracture Rates. In the paper Very Low Rates of...Ch. B.1 - Prob. 26ECh. B.1 - Prob. 27ECh. B.1 - Prob. 28ECh. B.1 - Prob. 29ECh. B.1 - Gasoline Mileage Ratings. Refer to Exercise B.24,...Ch. B.1 - Hip Fracture Rates. Refer to Exercise B.25, where...Ch. B.1 - Drosophila Life-span. In the paper Extended...Ch. B.1 - Protein Content of Wheat. In their text, Methods...Ch. B.1 - Pine Tree Volume. Table B.2 on page B-5 provides...Ch. B.2 - Give an example of a. a second-degree polynomial...Ch. B.2 - In the polynomial regression equation y = 8 + 3x ...Ch. B.2 - Answer true or false to each of the following...Ch. B.2 - Explain why it is difficult to interpret the...Ch. B.2 - Fill in the blanks. a. A predictor variable is...Ch. B.2 - Answer true or false to each of the following...Ch. B.2 - Refer to the scatterplots in Outputs B.32(a) and...Ch. B.2 - Fill in the blanks. a. In the _______ method for...Ch. B.2 - Answer true or false to each of the following...Ch. B.2 - Stopping Distance. In their text Methods of...Ch. B.2 - Hour of Birth. In the paper increased Frequency of...Ch. B.2 - Silica Gel. Silica gel is a substance that absorbs...Ch. B.2 - Note: The data for the Using Technology exercises...Ch. B.2 - Hour of Birth. Refer to Exercise B.45, where the...Ch. B.2 - Silica Gel. Refer to Exercise B.46, where the...Ch. B.2 - Gasoline Mileage Ratings. Refer to Exercise B.24...Ch. B.2 - Protein Content of Wheat. Refer to Exercise B.33...Ch. B.2 - Satellite Orbits. Each issue of the magazine Ad...Ch. B.2 - Pine Tree Volume. In Example B.6 on page B-4, we...Ch. B.3 - Explain the difference between a quantitative...Ch. B.3 - In predicting a person's income, identify two...Ch. B.3 - In predicting the change in blood pressure for...Ch. B.3 - Fill in the blanks. a. A ___ predictor variable is...Ch. B.3 - Prob. 59ECh. B.3 - Answer true or false to each of the following...Ch. B.3 - For the regression equation y = 15 + 2x1 + 4x2 ...Ch. B.3 - Refer to Exercise B.61: a. Do the slopes of the...Ch. B.3 - Consider the regression equation y = 0 + 1 x1+ 2x2...Ch. B.3 - Prob. 64ECh. B.3 - Prob. 65ECh. B.3 - Prob. 66ECh. B.3 - Home Sale Prices. Refer to Example B.18 on page...Ch. B.3 - Mental Tasks and Drugs. In the text Statistical...Ch. B.3 - Gasoline Mileage Ratings. Refer to Exercise B.66...Ch. B.3 - Home Sale Prices. Refer to Exercise B.67 regarding...Ch. B.3 - Mental Tasks and Drugs. Refer to Exercise B.68...Ch. B.3 - Hip Fracture Rates. Refer to Exercise B.25 on page...Ch. B.3 - Television Viewing. The results of a study on...Ch. B.3 - Glue Strength. In the text Quality Control and...Ch. B.4 - Explain why the interpretation of the regression...Ch. B.4 - Answer true or false to each of the following...Ch. B.4 - Explain what is meant by multicollinearity.Ch. B.4 - Fill in the blanks. a. Consider a regression model...Ch. B.4 - Prob. 79ECh. B.4 - Prob. 80ECh. B.4 - Fill in the blanks. a. If predictor variable x1...Ch. B.4 - Answer true or false to each of the following...Ch. B.4 - State four ways to detect the presence of...Ch. B.4 - Prob. 84ECh. B.4 - Prob. 85ECh. B.4 - Prob. 86ECh. B.4 - Prob. 87ECh. B.4 - Prob. 88ECh. B.4 - Graduation Rates. Refer to Exercise B.86, where we...Ch. B.4 - Prob. 90ECh. B.4 - Gasoline Mileage Ratings. Refer to Exercise B.84,...Ch. B.4 - Graduation Rules. Refer to Exercise B.86, where we...Ch. B.5 - Explain what is meant by the variable selection...Ch. B.5 - Prob. 94ECh. B.5 - Fill in the blanks. a. In the forward selection...Ch. B.5 - Prob. 96ECh. B.5 - Answer true or false to each of the following...Ch. B.5 - Prob. 98ECh. B.5 - Prob. 99ECh. B.5 - Prob. 100ECh. B.5 - Prob. 101ECh. B.5 - Suppose that x1, x2, x3, and x4 are predictor...Ch. B.5 - Prob. 103ECh. B.5 - Graduation Rates. Refer to Exercise B.92 on page...Ch. B.5 - Home Sale Prices. In Example B. 18 on page B-67,...Ch. B.5 - Home Sale Prices. In Example B.18 on page B-67, we...Ch. B.5 - Infant Mortality Rates. In the article Children's...Ch. B.6 - Consider a multiple linear regression relating the...Ch. B.6 - Prob. 109ECh. B.6 - Prob. 110ECh. B.6 - Answer true or false to each of the following...Ch. B.6 - Explain the similarities and differences between...Ch. B.6 - Fill in the blanks. a. In the Mallows Cp...Ch. B.6 - Answer true or false to each of the following...Ch. B.6 - Gasoline Mileage Ratings. Refer to Exercise B.84...Ch. B.6 - Advertising and Sales. Refer to Exercise B.85 on...Ch. B.6 - Graduation Rates. Refer to Exercise B.86 on page...Ch. B.6 - Suppose that x1, x2, x3, and x4 are predictor...Ch. B.6 - Suppose that x1 x2, x3, and x4 are predictor...Ch. B.6 - Gasoline Mileage Ratings. Refer to Exercise B.91...Ch. B.6 - Graduation Rates. Refer to Exercise B.92 on page...Ch. B.6 - Home Sale Prices. Refer to Exercise B.105 on page...Ch. B.6 - Body Fat. Refer to Exercise B.106 on page B-143,...Ch. B.6 - Infant Mortality Rates. Refer to Exercise B.107 on...Ch. B.7 - List six problems that can arise in the collection...Ch. B.7 - Prob. 126ECh. B.7 - Prob. 127ECh. B.7 - Give an example of how a nonrepresentative sample...Ch. B.7 - Discuss the effect on a regression analysis of not...Ch. B.7 - Explain how multicollinearity can adversely affect...Ch. B.7 - Briefly describe what is meant by the problem of...Ch. B.7 - Answer true or false to each of the following...Ch. B.7 - Prob. 133ECh. B.7 - Discuss the advantages of using data collected...Ch. B.7 - Describe the potential effects of outliers on...Ch. B.7 - Prob. 136ECh. B.7 - Regarding regression analysis: a. What assumptions...Ch. B.7 - Answer true or false to each of the following...Ch. B.7 - Answer true or false to each of the following...Ch. B.7 - Discuss what G. E. P. Box might have meant when he...Ch. B.7 - Regarding model validation in regression: a. What...Ch. B - Explain what is meant when we say that a nonlinear...Ch. B - Answer true or false to the following statements...Ch. B - Prob. 3RPCh. B - Prob. 4RPCh. B - Answer true or false to each of the following...Ch. B - Paper Strength. In their text, Introduction to...Ch. B - Answer true or false to each of the following...Ch. B - Prob. 8RPCh. B - Explain what is meant when we say that a...Ch. B - OUTPUT B.95 Output for Problem 10 Regression...Ch. B - In regressing a response variable on several...Ch. B - Answer true or false to each of the following...Ch. B - Fill in the blanks. a. Multicollinearity is...Ch. B - Prob. 14RPCh. B - Explain why selecting a regression equation using...Ch. B - Answer true or false to each of the following...Ch. B - Fill in the blanks. a. In the _____ method, we...Ch. B - Patent Production. In the report The State New...Ch. B - Prob. 19RPCh. B - Prob. 20RPCh. B - Patent Production. Refer to Problem 18. where we...Ch. B - Prob. 22RPCh. B - Prob. 23RPCh. B - What are the possible consequences of the presence...Ch. B - Windmill Output. Refer to Problem 3, where we...Ch. B - Paper Strength. Refer to Problem 6, where we...Ch. B - Diabetes. Refer to Problem 10, where we considered...Ch. B - Hospital Stalling. Refer to Problem 14, where we...Ch. B - Patent Production. Refer to Problem 18, where we...Ch. B - Patent Production. Refer to Problem 29, where we...Ch. B - Recall from Chapter 1 of your text that the Focus...Ch. B - At the beginning of this module on page B-l, we...
Knowledge Booster


Learn more about
Need a deep-dive on the concept behind this application? Look no further. Learn more about this topic, statistics and related others by exploring similar questions and additional content below.Similar questions
- Sam Jones has 2 years of historical sales data for his company. He is applyingfor a business loan and must supply his projections of sales by month for thenext 2 years to the bank. a. Using the data from Table 6–12, provide a regression forecast for timeperiods 25 through 48.b. Does Sam’s sales data show a seasonal pattern?arrow_forwardThe table gives the average heights of children for ages 1 – 10, where x = the age (in years) and y = the height (in cm). Part a: Make a scatter plot and determine which type of model best fits the data.Part b: Find the regression equation.Part c: Can your equation be used to find the average height of a 20 year old? Explain.arrow_forwardPart I. Run two regressions in Excel using the provided Excel file “Layoffs”.The Excel file Layoffs provides data on 50 manufacturing workers who lost their jobs due to layoffs. The data includes the following list of variables:Weeks – the number of weeks a manufacturing worker has been without a jobAge – the age of the workerEducation – the number of years of education of the workerMarried – a dummy variable, equal to 1 if the worker is married, 0 otherwiseHead – a dummy variable, equal to 1 if the worker is a head of household, 0 otherwiseTenure – the number of years on the previous jobManager – a dummy variable, equal to 1 if the worker had a management occupation, 0 otherwise Sales – a dummy variable, equal to 1 if the worker had an occupation in sales, 0 otherwise 1. Run a simple regression with a dependent variable Weeks and an independent variable Age. Create the regular and standardized residual plots for the simple regression. 2. Run a multiple regression with a dependent…arrow_forward
- I have no idea how to fill in the blank in this regression output... please helparrow_forwardWhich equation best represents the regression line for the data given in the table above? Oy=-3x+ 22 Oy=-3x-22 Oy= 3x+ 22 Oy= 3x- 22 71 hp Oly insertarrow_forwardThe following is the recorded earthquakes on South Carolina from August, 2016 to February, 2017. Use the data to find the residuals. Then draw a residual plot by hand. Use the residual plot to determine if the linear model is the best regression model for this data.arrow_forward
- Q2) Convert the data in table below into information using regression approach. X 1 2 3 4 5 6 Y 6 1 9 5 17 12arrow_forwarda. Write out the estimated linear regression equation. b. What is the estimated expected weight of an alligator that has snout Length=36 inches?arrow_forwardHot Dogs: The Caloric & Sodium (mg) Content of ten beef hot dogs are presented in Table 1. Determine the following for these data: Construct a scatter plot of these data in the space provided. Determine the regression equation for these data (r = .906; p< .01) Determine the estimated sodium content for a beef hot dog containing 112 caloriearrow_forward
- 3. Create two new independent variables: Top 2–5 and Top 6–10. Top 2–5 represents the number of times the driver finished between second and fifth place and Top 6–10 represents the number of times the driver finished between sixth and tenth place. Develop an estimated regression equation that can be used to predict Winnings ($) using Poles, Wins, Top 2–5, and Top 6–10. Test for individual significance and discuss your findings and conclusions. Driver Points Poles Wins Top 5 Top 10 Winnings ($) Tony Stewart 2403 1 5 9 19 6,529,870 Carl Edwards 2403 3 1 19 26 8,485,990 Kevin Harvick 2345 0 4 9 19 6,197,140 Matt Kenseth 2330 3 3 12 20 6,183,580 Brad Keselowski 2319 1 3 10 14 5,087,740 Jimmie Johnson 2304 0 2 14 21 6,296,360 Dale Earnhardt Jr. 2290 1 0 4 12 4,163,690 Jeff Gordon 2287 1 3 13 18 5,912,830 Denny Hamlin 2284 0 1 5 14 5,401,190 Ryan Newman 2284 3 1 9 17 5,303,020 Kurt Busch 2262 3 2 8 16 5,936,470 Kyle Busch 2246 1 4 14 18 6,161,020 Clint Bowyer…arrow_forwardIf we performed a t-test, how many people would be in the study based on the regression model in photo.arrow_forwardFind the fitted regression line for these data.arrow_forward
arrow_back_ios
SEE MORE QUESTIONS
arrow_forward_ios
Recommended textbooks for you
 Calculus For The Life SciencesCalculusISBN:9780321964038Author:GREENWELL, Raymond N., RITCHEY, Nathan P., Lial, Margaret L.Publisher:Pearson Addison Wesley,
 Functions and Change: A Modeling Approach to Coll...AlgebraISBN:9781337111348Author:Bruce Crauder, Benny Evans, Alan NoellPublisher:Cengage Learning
Calculus For The Life Sciences
Calculus
ISBN:9780321964038
Author:GREENWELL, Raymond N., RITCHEY, Nathan P., Lial, Margaret L.
Publisher:Pearson Addison Wesley,
Functions and Change: A Modeling Approach to Coll...
Algebra
ISBN:9781337111348
Author:Bruce Crauder, Benny Evans, Alan Noell
Publisher:Cengage Learning
Correlation Vs Regression: Difference Between them with definition & Comparison Chart; Author: Key Differences;https://www.youtube.com/watch?v=Ou2QGSJVd0U;License: Standard YouTube License, CC-BY
Correlation and Regression: Concepts with Illustrative examples; Author: LEARN & APPLY : Lean and Six Sigma;https://www.youtube.com/watch?v=xTpHD5WLuoA;License: Standard YouTube License, CC-BY