
Videos
Bubble behavior in subcooled flow boiling. In industry cooling applications (e.g., cooling of nuclear reactors), a process called subcooled flow boiling is often employed. Subcooled flow boiling is susceptible to small bubbles that occur near the heated surface. The characteristics of these bubbles were investigated in Heat Transfer Engineering (Vol. 34., 2013). A series of experiments was conducted to measure two important bubble behaviors—bubble diameter (millimeters) and bubble density (liters per meters squared). The mass flux (kilograms per meters squared per second) and heat flux (megawatts per meters squared) were varied for each experiment. The data obtained at a set pressure are listed in the following table.
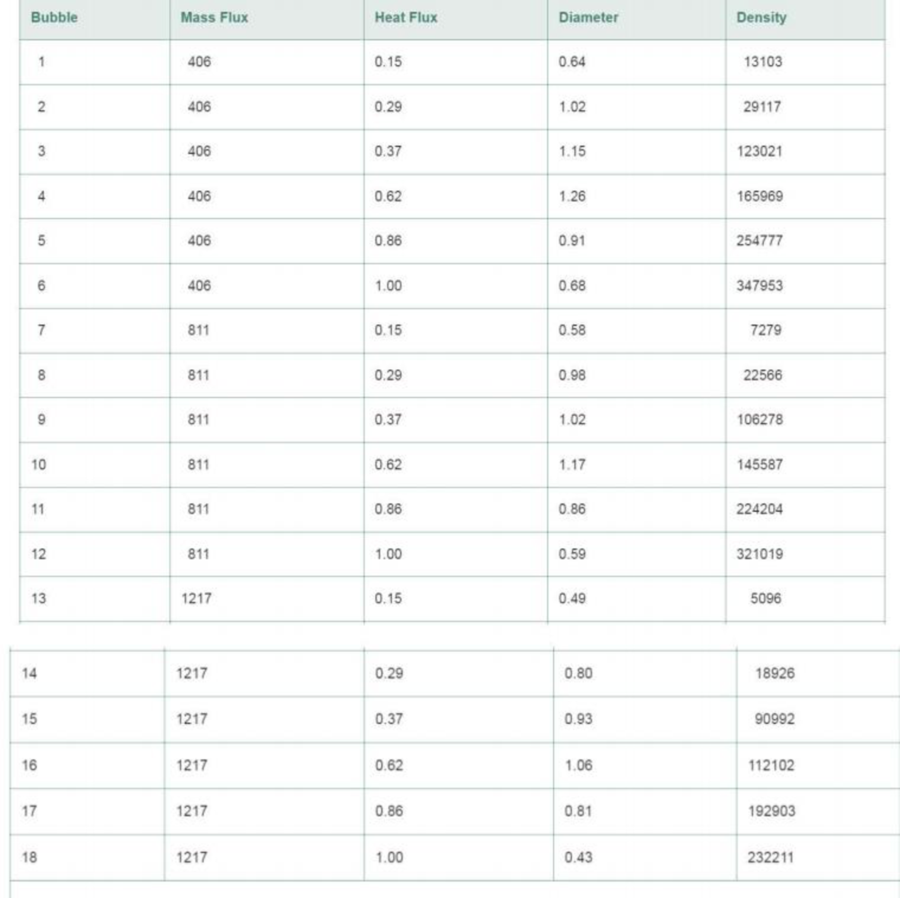
a. Consider the multiple regression model, E (y1) = β0 + β1 x1 + β2x2, where y1 = bubble diameter, x1 = mass flux, and x2 = heat flux. Use statistical software to fit the model to the data and test the overall adequacy of the model.
b. Consider the multiple regression model, E(y2) = β0 + β1 x1 + β2x2, where y2 = bubble density, x1 = mass flux, and x2 = heat flux. Use statistical software to fit the model to the data and test the overall adequacy of the model.
c. Which of the two dependent variables, diameter (y1) or density (y2). is better predicted by mass flux (x1) and heat flux (x2)?
Want to see the full answer?
Check out a sample textbook solution
Chapter 12 Solutions
Statistics for Business and Economics (13th Edition)


- In "Orthogonal Design for Process Optimization and Its Application to Plasma Etching" (Solid State Technology, May 1987), G. Z. Yin and D. W. Jillie describe an experiment to determine the effect of C2Fe flow rate on the uniformity of the etch on a silicon wafer used in integrated circuit manufacturing. Three flow rates are used in the experiment, and the resulting uniformity (in percent) for six replicates is shown below. Observations C„F. Flow (SCCM) 2 3 4 5 125 2.5 4.4 2.6 3.2 3.2 4.0 160 4.8 4.4 4.8 4.2 3.6 4.2 200 4.6 3.3 2.8 3.4 4.2 5.3 (a) Does C,F, flow rate affect etch uniformity? Construct box plots to compare the factor levels and perform the analysis of variance. Use a = 0.05. There is that flow rate affects etch uniformity. (b) Do the residuals indicate any problems with the underlying assumptions? No. Statistical Tables and Charts Yes.arrow_forwardFluid inclusions are microscopic volumes of fluid that are trapped in rock during rock formation. The article "Fluid Inclusion Study of Metamorphic Gold-Quartz Veins in Northwestern Nevada, U.S.A.: Characteristics of Tectonically Induced Fluid" (S. Cheong, Geosciences Journal, 2002:103-115) describes the geochemical properties of fluid inclusions in several different veins in northwest Nevada. The following table presents data on the maximum salinity (% NaCi by weight) of inclusions in several rock samples from several areas. Salinity Area Humboldt Range Santa Rosa Range 9.2 10.0 11.2 8.8 5.2 6.1 8.3 Ten Mile 7.9 6.7 9.5 7.3 10.4 7.0 Antelope Range Pine Forest Range 6.7 8.4 9.9 10.5 16.7 17.5 15.3 20.0 Can you conclude that the salinity differs among the areas?arrow_forwardNeed help with (c) and (d) Mist (airborne droplets or aerosols) is generated when metal-removing fluids are used in machining operations to cool and lubricate the tool and workpiece. Mist generation is a concern to OSHA, which has recently lowered substantially the workplace standard. An article gave the accompanying data on x = fluid-flow velocity for a 5% soluble oil (cm/sec) and y = the extent of mist droplets having diameters smaller than 10 µm (mg/m3): x 88 177 182 354 369 442 970 y 0.39 0.60 0.50 0.66 0.61 0.69 0.92 (a) The investigators performed a simple linear regression analysis to relate the two variables. Does a scatter plot of the data support this strategy? (b) What proportion of observed variation in mist can be attributed to the simple linear regression relationship between velocity and mist? (Round your answer to three decimal places.) (c) The investigators were particularly interested in the impact on mist of increasing velocity from 100 to 1000 (a…arrow_forward
- The article "Experimental Measurement of Radiative Heat Transfer in Gas-Solid Suspersion Flaw System" (G. Han, K. Tuxla, and J. Chen, AChe Journal, 2002:1910-1916) discusses the a radiometer. Several measurements were made on the electromotive force readings of the radiometer (in volts) and the radiation flux (in kilowatts per square meter). Signal Output, x Heat Flux, y Predicted/Fitted Residual 1.08 15 2.42 31 4.17 51 4,46 55 5.17 67 6.92 89 For this data, the least squares line is = 0.153 + 12.679 x. Find the predicted/fitted values for each observed x value and find the residual for each observed x value. What is the predicted value of a Signal Output of 5.17? Round your answer to 3 decimal places.arrow_forwardPlasma etching is essential to the fine-line pattern transfer in current semiconductor processes. An article gives the accompanying data (read from a graph) on chlorine flow (x, in SCCM) through a nozzle used in the etching mechanism and etch rate (y, in 100 A/min). x 1.5 1.6 2.0 2.5 2.5 3.0 3.5 3.5 3.9 y 24.5 24.5 25.5 29.5 33.5 39.0 40.5 44.5 50.0 (a) Create a 99% two-sided confidence interval for the true average change in etch rate associated with a 1-SCCM increase in flow rate. (Round your answers to 3 decimal places, if needed.)(, )(b) Create a 99% two-sided confidence interval for the true average etch rate when flow is 3.5. (Round your answers to 3 decimal places, if needed.)Predicted value = Standard error = (, )(c) Create a 99% two-sided prediction interval for an etch rate when flow is 3.5. (Round your answers to 3 decimal places, if needed.)Predicted value = Standard error = (, )(d) Would the 95% CI and PI when flow is 2.5 be wider or narrower than the…arrow_forwardFor steady-state water flow in a circular pipe made of concrete The following data have been collected: PIPE DIAMETER 0.3 EXPERIMENT SLOPE m/s VOLUMETRIC 1 0.001 0.04 2 0,6 0,.001 0,24 0.9 0,001 0,69 4 0.3 0,01 0,13 0.6 0,01 0.82 6. 0,9 0,01 2,38 7 0,3 0.05 0,31 8. 0.6 0.05 1.95 0,9 0.05 5.66 Determine the parameters (a0, a1 and a2) in the equation for the relation between Volumetric flow, Slope and Pipe Diameter using nonLinear Regression analysis Q = a,Dª S°:arrow_forward
- An article in the Journal of the American Ceramic Society, "Rapid Hot-Pressing of Ultrafine PSZ Powders" (1991, Vol. 74, pp. 1547-1553) considered the microstructure of the ultrafine powder of partially stabilized zirconia as a function of temperature. The data are shown below: ... Temperature (°C) 1100 1200 1300 1100 1500 1200 1300 y - Porosity (%) 30.8 19.2 6 13.5 11.4 7.7 3.6 Find an estimate of o2 Input answers up to two decimal places. o2= Blank 1arrow_forwardPlasma etching is essential to the fine-line pattern transfer in current semiconductor processes. An article gives the accompanying data (read from a graph) on chlorine flow (x, in SCCM) through a nozzle used in the etching mechanism and etch rate (y, in 100 A/min). 1.5 1.6 2.0 2.5 2.5 3.0 3.5 3.5 3.9 y 24.5 24.5 25.5 29.5 33.5 39.0 40.5 44.5 50.0 (a) Create a 99% two-sided confidence interval for the true average change in etch rate associated with a 1-SCCM increase in flow rate. (Round your answers to 3 decimal places, if needed.) (b) Create a 99% two-sided confidence interval for the true average etch rate when flow is 3.5. (Round your answers to 3 decimal places, if needed.) Predicted value = Standard error = (c) Create a 99% two-sided prediction interval for an etch rate when flow is 3.5. (Round your answers to 3 decimal places, if needed.) Predicted value = Standard error = (d) Would the 95% Cl and Pl when flow is 2.5 be wider or narrower than the corresponding intervals of parts…arrow_forwardComputer chips often contain surface imperfections.For a certain type of computer chip, theprobability mass function of the number of defects X is presented in the following table.arrow_forward
- 17.7 Butterfly wings. Researchers studied the morphological attributes of monarch butterflies (Danaus plexippus), a species that undertakes large seasonal migrations over North America. They measured the forewing weight (in milligrams, mg) of a sample of 92 monarch butterflies, all of which had been reared in captivity in identical conditions.° Figure 17.4 shows the output from the statistical software JMP. (The data are also available in the Large.Butterfly the data file if you wish to practice working with your own software.) Estimate with 95% confidence the mean forewing weight of monarch butterflies reared in captivity. Follow the four- step process as illustrated in Example 17.2. 4 STEP そMP FWweight 30 25 20 15 10 11 12 13 14 15 8 9 10 Summary Statistics Mean 11.795652 Std Dev 1.1759413 Std Err Mean 0.1226004 Upper 95% Mean Lower 95% Mean 1 FIGURE 17.4 Software output (JMP) for the forewing weight of monarch 12.039183 11.552122 92 N. butterflies. Countarrow_forwardIn Applied Life Data Analysis (Wiley, 1982), Wayne Nelson presents the breakdown time of an insulating fluid between electrodes at 34 kV. The times, in minutes, are as follows: 0.19, 0.78, 0.96, 1.31, 2.78, 3.16, 4.15, 4.67, 4.85, 6.50, 7.35, 8.01, 8.27, 12.06, 31.75, 32.52, 33.91, 36.71, and 72.89. Calculate the sample mean and sample standard deviation.arrow_forwardThe article "Effect of Microstructure and Weathering on the Strength Anisotropy of Porous Rhyolite" (Y. Matsukura, K. Hashizume, and C. Oguchi, Engineering Geology, 2002:39- 17) investigates the relationship between the angle betwween cleavage and flow structure and the strength of porous rhyolite. Strengths (in MPa) were measured for a mumber of specimens cut at various angles. The mean and standard deviation of the strengths for each angle are presented in the following table. Angle Mean 0° 22.9 Sample Size Standard Deviation 2.98 12 15° 22.9 1.16 30° 19.7 3.00 45° 14.9 2.99 60° 13.5 2.33 75° 11.9 2.10 90 14.3 3.95 6. Can you conclude that strength varies with the angle?arrow_forward
 MATLAB: An Introduction with ApplicationsStatisticsISBN:9781119256830Author:Amos GilatPublisher:John Wiley & Sons Inc
 Probability and Statistics for Engineering and th...StatisticsISBN:9781305251809Author:Jay L. DevorePublisher:Cengage Learning
 Statistics for The Behavioral Sciences (MindTap C...StatisticsISBN:9781305504912Author:Frederick J Gravetter, Larry B. WallnauPublisher:Cengage Learning
 Elementary Statistics: Picturing the World (7th E...StatisticsISBN:9780134683416Author:Ron Larson, Betsy FarberPublisher:PEARSON
 The Basic Practice of StatisticsStatisticsISBN:9781319042578Author:David S. Moore, William I. Notz, Michael A. FlignerPublisher:W. H. Freeman
 Introduction to the Practice of StatisticsStatisticsISBN:9781319013387Author:David S. Moore, George P. McCabe, Bruce A. CraigPublisher:W. H. Freeman