
Statistics for Business and Economics (13th Edition)
13th Edition
ISBN: 9780134506593
Author: James T. McClave, P. George Benson, Terry Sincich
Publisher: PEARSON
expand_more
expand_more
format_list_bulleted
Concept explainers
Videos
Textbook Question
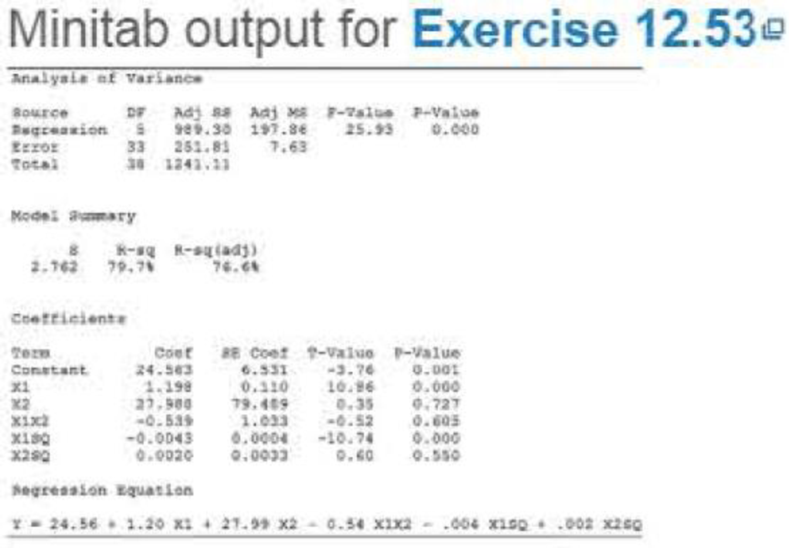
Chapter 12.6, Problem 12.53LM
Minitab was used to fit the complete second-order model
E(y) = β0 + β1x1 + β2x2 + β3x1x2 + β4
to n = 39 data points. The printout is shown on the next page.
- a. Is there sufficient evidence to indicate that at least one of the parameters—β1, β2, β3, β4, and β5—is nonzero? Test using α =.05.
- b. Test H0 : β4 = 0 against Ha : β4 ≠ 0. Use α =.01.
- c. Test H0 : β5 = 0 against Ha : β4 ≠ 0. Use α =.01.
- d. Use graphs to explain the consequences of the tests in parts b and c.
Expert Solution & Answer
Want to see the full answer?
Check out a sample textbook solution
Students have asked these similar questions
A random sample of 65 high school seniors was selected from all high school seniors at a certain high school. A scatterplot (not shown) revealed the height, in cm and foot length in cm, for each high school student from the sample. The association was described to be strong, positive, and linear.
a. In the context of the study, explain what is meant by the following terms:
positive:
linear:
b. The least squares regression equation was predicted height=105.08+2.599 (foot length). One of the students had a foot length of 20 cm. His residual was calculated to be 2.94 cm. What was the height of the student?
c. suppose that the distribution of residuals is approximately normal with a standard deviation of 5.9 cm. What percent of residuals are less than 7 cm? Justify why.
Which of the independent variables retains the strongest association with the number of children a respondent has when all other variables in the model are controlled?
An aircraft company wanted to predict the number of worker-hours necessary to finish the design of a new plane. Relevant explanatory variables were thought to be the plane’s top speed, its weight, and the number of parts it had in common with other models built by the company. A sample of 27 of the company’s planes was taken, and the following model was estimated:y = β0 + β1x1 + β2x2 + β3x3 + εwherey = design effort, in millions of worker-hoursx1 = plane’s top speed, in miles per hourx2 = plane’s weight, in tonsx3 = percentage number of parts in common with other modelsThe estimated regression coefficients were as follows:b1 = 0.661 b2 = 0.065 b3 = -0.018and the estimated intercept was 2.0.Predict design effort for a plane with a top speed of Mach 1.0, weighing 7 tons, and having 50% of itsparts in common with other models.
Chapter 12 Solutions
Statistics for Business and Economics (13th Edition)
Ch. 12.3 - Write a first-order model relating E(y) to a. two...Ch. 12.3 - Minitab was used to fit the model E(y) = (0 + 1x1...Ch. 12.3 - Suppose you fit the multiple regression model y =0...Ch. 12.3 - Suppose you fit the first-order multiple...Ch. 12.3 - Prob. 12.5LMCh. 12.3 - Prob. 12.6LMCh. 12.3 - Prob. 12.7LMCh. 12.3 - If the analysis of variance F-test leads to the...Ch. 12.3 - Ambiance of 5-star hotels. Although invisible and...Ch. 12.3 - Forecasting movie revenues with Twitter. Refer to...
Ch. 12.3 - Accounting and Machiavellianism. Refer to the...Ch. 12.3 - Prob. 12.12ACBCh. 12.3 - Predicting elements in aluminum alloys. Aluminum...Ch. 12.3 - Novelty of a vacation destination. Many tourists...Ch. 12.3 - Arsenic in groundwater. Environmental Science ...Ch. 12.3 - Reality TV and cosmetic surgery. How much...Ch. 12.3 - Contamination from a plant's discharge. Refer to...Ch. 12.3 - Cooling method for gas turbines. Refer to the...Ch. 12.3 - Rankings of research universities. Refer to the...Ch. 12.3 - Bubble behavior in subcooled flow boiling. In...Ch. 12.3 - Prob. 12.22ACICh. 12.3 - Prob. 12.23ACACh. 12.3 - Prob. 12.24ACACh. 12.4 - Characteristics of lead users. Refer to the...Ch. 12.4 - Prob. 12.26ACBCh. 12.4 - Reality TV and cosmetic surgery. Refer to the Body...Ch. 12.4 - Chemical plant contamination. Refer to Exercise...Ch. 12.4 - Prob. 12.29ACBCh. 12.4 - Arsenic in groundwater. Refer to the Environmental...Ch. 12.4 - Prob. 12.32ACICh. 12.4 - Prob. 12.33ACICh. 12.4 - Boiler drum production. In a production facility,...Ch. 12.5 - Suppose the true relationship between E(y) and the...Ch. 12.5 - Suppose you fit the interaction model y = 0 + x1 +...Ch. 12.5 - Prob. 12.37LMCh. 12.5 - Tipping behavior in restaurants. Can food servers...Ch. 12.5 - Forecasting movie revenues with Twitter. Refer to...Ch. 12.5 - Prob. 12.41ACBCh. 12.5 - Prob. 12.42ACBCh. 12.5 - Reality TV and cosmetic surgery. Refer to the Body...Ch. 12.5 - Factors that impact an auditors judgment. A study...Ch. 12.5 - Service workers and customer relations. A study in...Ch. 12.5 - Bubble behavior in subcooled flow boiling. Refer...Ch. 12.5 - Arsenic in groundwater. Refer to the Environmental...Ch. 12.5 - Cooling method for gas turbines. Refer to the...Ch. 12.6 - Write a second-order model relating the mean of y,...Ch. 12.6 - Prob. 12.50LMCh. 12.6 - Prob. 12.51LMCh. 12.6 - Prob. 12.52LMCh. 12.6 - Minitab was used to fit the complete second-order...Ch. 12.6 - Personality traits and job performance. When...Ch. 12.6 - Going for it on fourth-down in the NFL. Refer to...Ch. 12.6 - Prob. 12.56ACBCh. 12.6 - Prob. 12.57ACBCh. 12.6 - Assertiveness and leadership. Management...Ch. 12.6 - Goal congruence in top management teams. Do chief...Ch. 12.6 - Prob. 12.60ACICh. 12.6 - Revenues of popular movies. The Internet Movie...Ch. 12.6 - Prob. 12.62ACICh. 12.6 - Prob. 12.63ACICh. 12.6 - Prob. 12.64ACICh. 12.6 - Prob. 12.65ACICh. 12.7 - Write a regression model relating the mean value...Ch. 12.7 - Prob. 12.67LMCh. 12.7 - Prob. 12.68LMCh. 12.7 - Prob. 12.69LMCh. 12.7 - Prob. 12.70ACBCh. 12.7 - Prob. 12.71ACBCh. 12.7 - Prob. 12.72ACBCh. 12.7 - Prob. 12.73ACBCh. 12.7 - Buy-side vs. sell-side analysts earnings...Ch. 12.7 - Prob. 12.75ACBCh. 12.7 - Charisma of top-level leaders. Refer to the...Ch. 12.7 - Corporate sustainability and firm characteristics....Ch. 12.7 - Homework assistance for accounting students. Refer...Ch. 12.7 - Improving driving performance while fatigued....Ch. 12.7 - Prob. 12.80ACACh. 12.7 - Banning controversial sports team sponsors. Refer...Ch. 12.8 - Consider a multiple regression model for a...Ch. 12.8 - Prob. 12.83LMCh. 12.8 - Consider the model: y = 0+ 1x1+ 2 x2+ 3 x3+...Ch. 12.8 - Consider the model:...Ch. 12.8 - Prob. 12.86LMCh. 12.8 - Reality TV and cosmetic surgery. Refer to the Body...Ch. 12.8 - Do blondes raise more funds? Refer to the Economic...Ch. 12.8 - Prob. 12.89ACBCh. 12.8 - Buy-side vs. sell-side analysts earnings...Ch. 12.8 - Workplace bullying and intention to leave....Ch. 12.8 - Agreeableness, gender, and wages. Do agreeable...Ch. 12.8 - Chemical plant contamination. Refer to Exercise...Ch. 12.8 - Prob. 12.94ACICh. 12.8 - Recently sold, single-family homes. The National...Ch. 12.8 - Charisma of top-level leaders Refer to the Academy...Ch. 12.9 - Determine which pairs of the following models are...Ch. 12.9 - Prob. 12.98LMCh. 12.9 - Prob. 12.99LMCh. 12.9 - Shared leadership in airplane crews. Refer to the...Ch. 12.9 - Buy-side vs. sell-side analysts earnings...Ch. 12.9 - Workplace bullying and intention to leave. Refer...Ch. 12.9 - Cooling method for gas turbines. Refer to the...Ch. 12.9 - Prob. 12.104ACBCh. 12.9 - Reality TV and cosmetic surgery. Refer to the Body...Ch. 12.9 - Study of supervisor-targeted aggression....Ch. 12.9 - Prob. 12.107ACICh. 12.9 - Recently sold, single-family homes. Refer to the...Ch. 12.9 - Prob. 12.109ACICh. 12.9 - Prob. 12.110ACACh. 12.10 - Prob. 12.111LMCh. 12.10 - Teacher pay and pupil performance. In Economic...Ch. 12.10 - Risk management performance. An article in the...Ch. 12.10 - Accuracy of software effort estimates....Ch. 12.10 - Diet of ducks bred for broiling. Corn is high in...Ch. 12.10 - Reality TV and cosmetic surgery. Refer to the Body...Ch. 12.10 - Prob. 12.117ACICh. 12.10 - Prob. 12.118ACICh. 12.10 - Prob. 12.119ACICh. 12.12 - Identify the problem(s) in each of the residual...Ch. 12.12 - Consider fitting the multiple regression model...Ch. 12.12 - Emotional intelligence and team performance. Refer...Ch. 12.12 - State casket sales restrictions. Some states...Ch. 12.12 - Personality traits and job performance. Refer to...Ch. 12.12 - Women in top management. Refer to the Journal of...Ch. 12.12 - Accuracy of software effort estimates. Refer to...Ch. 12.12 - Arsenic in groundwater. Refer to the Environmental...Ch. 12.12 - Reality TV and cosmetic surgery. Refer to the Body...Ch. 12.12 - Failure times of silicon wafer microchips. Refer...Ch. 12.12 - Bubble behavior in subcooled flow boiling. Refer...Ch. 12.12 - Banning controversial sports team sponsors. Refer...Ch. 12.12 - Cooling method for gas turbines. Refer to the...Ch. 12.12 - Agreeableness, gender, and wages. Refer to the...Ch. 12 - Suppose you have developed a regression model to...Ch. 12 - When a multiple regression model is used for...Ch. 12 - Suppose you fit the model y=0+1x1+2x12+3x2+4x1x2+...Ch. 12 - Prob. 12.137LMCh. 12 - Prob. 12.138LMCh. 12 - Prob. 12.139LMCh. 12 - Prob. 12.140LMCh. 12 - Prob. 12.141LMCh. 12 - Prob. 12.142LMCh. 12 - Prob. 12.143LMCh. 12 - Prob. 12.144LMCh. 12 - Comparing private and public college tuition....Ch. 12 - Prob. 12.146ACBCh. 12 - Prob. 12.147ACBCh. 12 - Highway crash data analysis. Researchers at...Ch. 12 - Prob. 12.149ACBCh. 12 - Mental health of a community. An article in the...Ch. 12 - Prob. 12.151ACBCh. 12 - Testing tires for wear. Underinflated or...Ch. 12 - Prob. 12.153ACBCh. 12 - Prob. 12.154ACBCh. 12 - Prob. 12.155ACBCh. 12 - Prob. 12.156ACBCh. 12 - Prob. 12.157ACBCh. 12 - Promotion of supermarket vegetables. A supermarket...Ch. 12 - Yield strength of steel alloy. Industrial...Ch. 12 - Prob. 12.160ACICh. 12 - Prob. 12.161ACICh. 12 - Improving Math SAT scores. Refer to the Chance...Ch. 12 - Prob. 12.163ACICh. 12 - Prob. 12.164ACICh. 12 - Prob. 12.165ACICh. 12 - Prob. 12.166ACICh. 12 - Sale prices of apartments. A Minneapolis,...Ch. 12 - Volatility of foreign stocks. The relationship...Ch. 12 - Prob. 12.169ACICh. 12 - Prob. 12.170ACICh. 12 - State casket sales restrictions Refer to the...Ch. 12 - Modeling monthly collision claims. A medium-sized...Ch. 12 - Developing a model for college GPA. Many colleges...
Knowledge Booster


Learn more about
Need a deep-dive on the concept behind this application? Look no further. Learn more about this topic, statistics and related others by exploring similar questions and additional content below.Similar questions
- For the following table of data. x 1 2 3 4 5 6 7 8 9 10 y 0 0.5 1 2 2.5 3 3 4 4.5 5 a. draw a scatterplot. b. calculate the correlation coefficient. c. calculate the least squares line and graph it on the scatterplot. d. predict the y value when x is 11.arrow_forwardA popular musician believes an increase in the number of times songs are listened to via a streaming service leads to an increase in recording sales. The musician’s recording company selected 50 songs at random and used the data to test the claim that there is a positive linear relationship between the number of times a song is listened to and recording sales. The following hypotheses were used to test the claim. H0:β1=0 Ha:β1>0 The test yielded a t-value of 1.592 with a corresponding p-value of 0.059. Which of the following is the correct interpretation of the p-value? A. If the alternative hypothesis is true, the probability of observing a test statistic of 1.592 or smaller is 0.059. B. If the alternative hypothesis is true, the probability of observing a test statistic of 1.592 or greater is 0.059. C. If the null hypothesis is true, the probability of observing a test statistic of 1.592 or greater is 0.059. D. If the null hypothesis is true, the probability of observing a…arrow_forwardSuppose the simple linear regression model, Yi = β0 + β1 xi + Ei, is used to explain the relationship between x and y. A random sample of n = 12 values for the explanatory variable (x) was selected and the corresponding values of the response variable (y) were observed. A summary of the statistics is presented in the photo attached. Let b1 denote the least squares estimator of the slope coefficient, β1. What is the value of b1?arrow_forward
- An automobile dealer conducted a test to determine if the time in minutes needed to complete a minor engine tune-up depends on whether a computerized engine analyzer or an electronic analyzer is used. Because tune-up time varies among compact, intermediate, and full-sized cars, the three types of cars were used as blocks in the experiment. The data obtained follow. Analyzer Computerized Electronic Compact 51 42 Car Intermediate 54 44 Full-sized 63 46 Use a = 0.05 to test for any significant differences. State the null and alternative hypotheses. O Ho: Camputerized = HElectronic H: "Computerized * HElectronic O Ho: HCamputerized * HElectronic H: "Computerized = "Electronic O Ho: "Compact = "Intermediate = "Full-sized Ha: "Compact * HIntermediate * HFull-sized O Ho: HComputerized = "Electronic = "Compact = "Intermediate = "Full-sized H: Not all the population means are equal. O Ho: HCompact * "Intermediate * HFull-sized Ha: "Compact = "Intermediate = "Full-sized Find the value of the…arrow_forwardUsing 25 observations on each variable, a computer program generated the following multiple regression model: yhat=69.2+2.87x1+5.81x21.83x3 If the standard errors of the coefficients of the independent variables are, respectively, 1.34, 4.84, and 0.70, can you conclude that the independent variable x1 is needed in the regression model? Let β1, β2, and β3 denote the coefficients of the 3 variables in this model, and use a two-sided hypothesis test and significance level of 0.05 to determine your answer. Carry your intermediate computations to at least three decimal places and round your answers as specified in the table. The null hypothesis: H0: The alternative hypothesis: H1: The type of test statistic: (Choose one)ZtChi squareF The value of the test statistic:(Round to at least two decimal places.) The two critical values at the 0.05 level of significance:(Round to at least two decimal places.) and Can you…arrow_forwardA data set is given below. (a) Draw a scatter diagram Comment on the type of relation that appears to exist between x and y. (b) Given that x = 3.6667, sx = 2.4221, y = 4.3167, sy = 1.6582, and r= -0.9445, determine the least-squares regression line. (c) Graph the least-squares regression line on the scatter diagram drawn in part (a). + OA. X (a) Choose the correct graph below. Ay 0 3 2 5 6 6 6.0 5.9 5.5 3.3 24 28 9). 6 X 537 OB. Ay 6- 6 Q I O C. 0 6 X O D. 6- 0 K o ●● 6 Xarrow_forward
- An automobile dealer conducted a test to determine if the time in minutes needed to complete a minor engine tune-up depends on whether a computerized engine analyzer or an electronic analyzer is used. Because tune-up time varies among compact, intermediate, and full-sized cars, the three types of cars were used as blocks in the experiment. The data obtained follow. Analyzer Computerized Electronic Compact 50 41 Car Intermediate 56 44 Full-sized 62 47 Use a = 0.05 to test for any significant differences. State the null and alternative hypotheses. O Ho: Hcompact * HIntermediate * HFull-sized Ha: "Compact = HIntermediate = 4Full-sized O Ho: HComputerized * HElectronic Ha: HComputerized = HElectronic O Ho: HComputerized = HElectronic Ha: "Computerized * HElectronic O Ho: HComputerized = HElectronic = "Compact = HIntermediate = "Full-sized H.: Not all the population means are equal. O Ho: HCompact = HIntermediate = HFull-sized Hai H compact * HIntermediate * HFull-sized Find the value of…arrow_forwardA researcher recorded the total number of minutes that 25 people spent looking at either a computer, phone, or television screen during a day and the number of minutes of sleep that they slept that night. The resulting data were used to conduct a hypothesis test to investigate whether there is a negative linear relationship between the total number of minutes spent looking at a screen and the number of minutes of sleep. What are the correct hypotheses for the test? Ho : b1 = 0 Ha : bị + 0 Ho : B1 = 0 Ha : B1 > 0 Но : В, — 0 H : B, < 0 Но : В, <0 Ha : B1 = 0 Ho : B1 = 0 E Ha : B1 + 0arrow_forwardA data set is given below. (a) Draw a scatter diagram. Comment on the type of relation that appears to exist between x and y. (b) Given that x = 3.6667, sx = 2.4221, y =4.1667, sy = 1.5958, and r= -0.9348, determine the least-squares regression line. (c) Graph the least-squares regression line on the scatter diagram drawn in part (a). A. 0- X (a) Choose the correct graph below. 0 y 0 2 3 5 6 6 5.7 5.7 5.4 3.2 24 26 6 B. 0- 5 D gd O C. 6- 0- 0 6 Q M OD. 6 Ay 0- O Q Qarrow_forward
- Q. 5 A random sample of nine custom homes provided the following data on size and price. X denotes size in hundreds of square feet and y denotes price in thousands of dollars. Predict the price of a 2600-sq ft house using the regression equation. 26 27 33 29 29 34 30 40 22 Y 540 555 575 577 606 661 738 804 496 b,= Exy -((En)()/) I x2 - CEx)Z Formula : Σ in Consturct Table for al pars Using totas ¥ numbers ofrom the table firch: 676 26 540 9 - b, t bix To find predictad price for 26v0 sq.6t. house, substitule 26 in ý equation. Tatals Answer =arrow_forwardA data set is given below. (a) Draw a scatter diagram. Comment on the type of relation that appears to exist between x and y. (b) Given that x = 3.8333, sx = 2.0412, y = 3.8833, sy = 1.5651, and r= -0.9338, determine the least-squares regression line. (c) Graph the least-squares regression line on the scatter diagram drawn in part (a). X y O A. 1 2 4 4 6 5.2 5.8 4.5 3.6 2.0 (a) Choose the correct graph below. Q 6 6 2.2 D There appears to be a linear, negative relationship. (b) y = x + ( (Round to three decimal places as needed.) B. 6- 0 Y ← O C. 6- 0 .. O D. Ay 67 0-arrow_forwardA data set is given below. (a) Draw a scatter diagram. Comment on the type of relation that appears to exist between x and y. (b) Given that x = 3.8333, sx = 2.0412, y = 4.3167, sy = 1.3363, and r= -0.9153, determine the least-squares regression line. (c) Graph the least-squares regression line on the scatter diagram drawn in part (a). X y 1 2 4 4 5.4 5.9 5.0 4.0 (a) Choose the correct graph below. O A. Q Q 2 B. There appears to be a linear, negative relationship. (b) y = -0.599 x + (6.614) (Round to three decimal places as needed.) (c) Choose the correct graph below. 6 6 2.6 3.0 B. Q Q L Q C. Q L D. Q Q L Qarrow_forward
arrow_back_ios
SEE MORE QUESTIONS
arrow_forward_ios
Recommended textbooks for you
 Calculus For The Life SciencesCalculusISBN:9780321964038Author:GREENWELL, Raymond N., RITCHEY, Nathan P., Lial, Margaret L.Publisher:Pearson Addison Wesley,
 Linear Algebra: A Modern IntroductionAlgebraISBN:9781285463247Author:David PoolePublisher:Cengage Learning
 Glencoe Algebra 1, Student Edition, 9780079039897...AlgebraISBN:9780079039897Author:CarterPublisher:McGraw Hill
Calculus For The Life Sciences
Calculus
ISBN:9780321964038
Author:GREENWELL, Raymond N., RITCHEY, Nathan P., Lial, Margaret L.
Publisher:Pearson Addison Wesley,
Linear Algebra: A Modern Introduction
Algebra
ISBN:9781285463247
Author:David Poole
Publisher:Cengage Learning
Glencoe Algebra 1, Student Edition, 9780079039897...
Algebra
ISBN:9780079039897
Author:Carter
Publisher:McGraw Hill
Statistics 4.1 Point Estimators; Author: Dr. Jack L. Jackson II;https://www.youtube.com/watch?v=2MrI0J8XCEE;License: Standard YouTube License, CC-BY
Statistics 101: Point Estimators; Author: Brandon Foltz;https://www.youtube.com/watch?v=4v41z3HwLaM;License: Standard YouTube License, CC-BY
Central limit theorem; Author: 365 Data Science;https://www.youtube.com/watch?v=b5xQmk9veZ4;License: Standard YouTube License, CC-BY
Point Estimate Definition & Example; Author: Prof. Essa;https://www.youtube.com/watch?v=OTVwtvQmSn0;License: Standard Youtube License
Point Estimation; Author: Vamsidhar Ambatipudi;https://www.youtube.com/watch?v=flqhlM2bZWc;License: Standard Youtube License